Showing posts with label Shipments. Show all posts

Nintendo hardware shipments, calendar 2009 Q1 or fiscal 2009 Q4: Things of Note

5/11/09

This quarter Wii surpassed SNES and became the second Nintendo home console to pass 50 million units shipped. About 11.5 million remain until it passes NES.


Very little movement in Japan this quarter.


At the end of 2008, Wii shipments were just below N64's final total in North America. With a quarter of over 3 million shipped, it's surpassed not only N64, but also SNES.


Wii long ago become the most successful Nintendo home console ever in Europe. This quarter still marks an interesting milestone, though, in that Wii has shipped more than NES and SNES combined. The previous four systems combined only come to 28.66 million. Wii has less than 10 million to go to pass that.


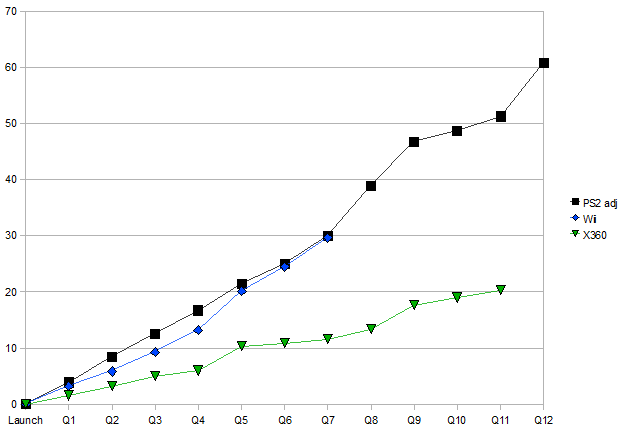
Though we are increasingly not near launch, there are still more Wiis available than any near-launch home console ever.


DS becomes the fourth gaming device to pass 100 million units shipped, if you count Game Boy and Game Boy Color together as does Nintendo. Current DS shipment numbers place it just below PS1.


Though neither DS nor Wii set an absolute worldwide shipping record for a January-February-March quarter this year, they were both among the best. Looking at the history of the top game machines around, here are the times when the first quarter of a calendar year went over 4 million. If GB/GBC or GBA ever had such a quarter we can't tell due to lack of quarterly shipment reports at their peaks, but making guesstimates based on their yearly or half-yearly numbers I doubt either would make this list.

PS2 2005: 6.08 M
DS 2008: 5.81 M
DS 2009: 5.56 M
Wii 2009: 5.43 M
DS 2007: 4.68 M
PS1 1998: 4.62 M
Wii 2008: 4.32 M
PS2 2001: 4.21 M


How about over the full fiscal year, though? In that case, DS and Wii did set records. As far as I can see, DS just had the best year for a portable system and Wii had the best year for a home console. Here are all years I know of over 20 million. Note that here 2009 indicates the year of April 1, 2008 through March 31, 2009.

DS  2009: 31.18 M
DS 2008: 30.31 M
Wii 2009: 25.94 M
DS 2007: 23.56 M
PS2 2003: 22.52 M
PS2 2004: 20.10 M
PS1 1999: 21.60 M


If you want to check out old shipment information for yourself, I recommend trying out the Garaph shipment line graph and shipment bar graph tools.

5/11/09

Landmark: Nintendo Passes 500 MILLION Systems Shipped

2/17/09

This is something I really should've noticed before. But better late than never?

As of the quarter ending September 30, 2008, Nintendo's combined shipments of home game consoles (NES, SNES, N64, GCN, and Wii) passed 200 million.

It's over 200 million!


As of the quarter ending December 31, 2008, Nintendo's combined shipments of portable game machines (Game Boy, Game Boy Color, Game Boy Advance, Nintendo DS, and the variations of each) is nearly 300 million. DS's numbers from the next quarter will probably push it over the edge.
It's over 300 million!  Almost!


Put together, as of the quarter ending December 31, 2008, their combined shipments of home and portable hardware passed 500 million.
It's over 500 million!

2/17/09

End 2008 hardware shipments: Things of Note

1/31/09

DS passed GBA last quarter. Its shoot up continues. It's certainly passed Game Boy and Game Boy Color individually, but as Nintendo prefers to report them as a whole, that's still the one barrier DS has to becoming Nintendo's most-sold system ever.


Here's the console equivalent. Don't take the early NES/SNES line segments seriously; since our first solid shipment data for them comes from the late 90s when they were almost finished, those looooong straight line segments representing 1983-1996 are simply the best we have. Wii has already passed GameCube and N64. SNES will probably be passed with another quarter. NES will take a little longer, but short a disaster Wii will be the most successful Nintendo home console ever by the end of 2009.


The line comparison is nice, but I also really like how this bar version looks, comparing Wii's growth with previous consoles' totals.


Europe continues to pull away as DS's biggest market, while Japan has had a slow year relative to DS's previous boom.


North America remains the stronghold for Wii, though. Japan is far in third here, accounting for less than half as many systems as second-place Europe.


It was already true that Wii was the most successful Nintendo console ever in Europe, but the amount by which that is true continues to grow. It's now nearly sold twice as much as second-place NES. I continue to think it's only a matter of time until it has outsold all previous four consoles combined, which would take about 28.7 million units.


For PS3 and X360 only worldwide numbers are available, so I can't go into as much detail.

In worldwide shipments at this age, PS3 is between where PS1 and PS2 were at this time. Keep in mind that both of those systems had a much more protracted worldwide launch, and that PS1 didn't have the advantage of coming in as the successor to the previous generation's champion. A sudden upturn to 100 million for PS3 still remains quite unlikely.


X360 beat the last-generation Xbox in the previous quarter; the rest of the growth here is gravy.


So how do they compare to the secondary and tertiary consoles of the last few generations? Pretty decently, really. Both are keeping their heads above the N64 mark, which was the previous best-selling secondary console at ~33 million. It's feasible that both X360 and PS3 will pass that by the end of 2009, though it's less of a certainty for PS3.


Though Wii has long since passed up X360 and PS3 individually, it's still a hard slog against the combined userbase of the HD consoles. At the end of 2007 the gap was about 8 million. By the end of September 2008 the PS360's lead had shrunk to 5.2 million. As of the end of 2008... it's 5.2 million. The holidays exacerbate Wii shortages, and it doesn't get quite the percentage boost of the others. It did better this holiday than last, however; in the final quarter of 2007, PS360 increased its lead over Wii by more than 2 million.


Thanks to Sony's change of shipment reporting methods a couple years ago and lack of giving decent LTD numbers since, I don't have anything fancy to show for PS2 or PSP.


To cap things off, the one phrase I may have used the most in discussions such as these:

There are more Wiis available than any near-launch home console ever.


At the same age, Wii shipments are about 50% ahead of #2 PS2, and more than double #3 PS3.

1/31/09

PS2 Shipments, Adjusted

8/8/08

Whenever shipment data comes up, it's the prudent thing to point out that comparing last-generation systems with current-generation systems is a strange thing due to the very different launch schedules. Every console this generation launched in a shorter time frame than any console last generation. So I had the idea to form a different sort of worldwide total by pretending each console launched in all regions in the same quarter, to create a more comparable situation to this generation. The downside to this is it downplays the production improvements made this generation. Sony didn't launch the PS2 in Europe 9 months after in Japan just for kicks, but because they couldn't produce enough. Creating a view like this erases that difference.

The other disadvantage is... really only PS2 has enough data to do this accurately; at least through early 2007, when they shipped to their different current shipment-reporting method. There's worldwide and regionally split PS2 shipment data for every quarter (and then some). GCN and Xbox only had half-year shipment reports for much of their lives, so I can't do the necessary quarterly shifts. PS3 shipments aren't reported regionally, so I can't do the shift at all. Wii and Xbox 360 actually did launch worldwide in a single quarter, so there's no adjusting to be made.

So for what it's worth, here's the no-adjustment-needed X360 and Wii aligned with the adjusted PS2, where NA and EU launches have been pushed up three quarters.


It's pretty remarkable how similar Wii and the adjusted PS2 are. But then, they've always seemed similar when broken down into single-region comparisons, so I guess that makes sense.

8/8/08

Xbox 360 and PlayStation 3 Hardware Shipments through June 2008

7/31/08

It seems wrong to just go over the Nintendo hardware shipment totals, so let's look at the other guys. Unfortunately there's not as much interesting to show for a number of reasons: Sony and Microsoft no longer give out separate shipment numbers per region. Neither PS3 nor X360 are setting records in a high or low way. Since Sony switched to their modern method of shipping they've only given the quarterly/yearly numbers rather than lifetime totals, which means for the moment we've lost track of where PS2 and PSP are at.

I'm trying something different for this post. My images can be made at arbitrary sizes, but at a size for column width here things don't look their greatest. Last time I made them bigger but gave the image tags a smaller size, which looked halfway decent in Firefox 3. However, in browsers that use simpler methods of image resizing (IE7, Firefox 2) those images look pretty awful. So as a compromise, I'll display the images created with a width of 400, but if you click on them they'll be created at a larger size. So the images shown here are not just smaller thumbnails of what the larger version will look like.


X360: 20.3 million. PS3: 14.37 million. Wii: 29.62 million. X360 and PS3 have on the whole performed similarly since PS3's launch, but PS3 does seem to be catching up: this is the third straight quarter PS3 has outshipped X360. In the last three quarters, PS3 has outshipped X360 by 1.88 million.


For the first year of each system from launch, they shipped very similar numbers. However, PS3 has continued to ship decently large numbers, while at this point in its life X360 shipments were pretty slow since they'd overshipped in the previous holiday season.

As I said earlier, they're not breaking records in a good or bad way. How do they compare to other recent secondary/tertiary consoles, though?


Pretty decently, actually. Both are above last generation's GCN/Xbox, and appear to be around N64 shipment territory. N64 and Sega Genesis are historically the top secondary systems, doing in the low 30 millions. That two systems at once are doing this well is pretty impressive. If they don't drop off as quickly as N64 did in its later days, they could become the new secondary/tertiary champs. Since both systems still have a lot of room for price drops and no party seems in a rush to launch the next generation, this seems quite possible.

However, they'd both have to do a hell of a lot better than N64 to come to the sort of totals currently predicted by users of the simExchange: 62 million (X360) and 73.5 million (PS3).

7/31/08

Nintendo Hardware Shipments through June 2008

7/30/08

Nintendo recently released their latest quarterly report, which can be found on their Investor Relations Information page. I want to use my shipment line graph generator to show off some of the new hardware shipment totals.

First, Wii. After almost 600 days on the market, shipments are just shy of 30 million. How does this compare to previous console champ PS2?


Worldwide, Wii is 10 million ahead of where PS2 was at the same age. However, PS2 had a staggered launch, with it releasing in Europe about 8.5 months after it did in Japan. How does Wii compare in each of the major regions?


PS2 retakes a slight lead in Japan.


Wii keeps a slight lead in North America. NA was GameCube's strongest market; Wii passes its NA shipment total this quarter.


And Wii takes a slight lead in Europe. It's also worth noting that historically Europe hasn't been a strong market for Nintendo. This is the first time any of their home consoles have shipped 10 million there. Yes, including NES (8.56 million) and SNES (8.58 million).

You might ask, "I thought Wii was breaking sales records all over the place. Why is it staying so even with PS2 in this count?" Two things come to mind. One is that these old PS2 numbers use Sony's old method of reporting shipments, which was really a measure of "produced and shipped to our warehouses". This inflates them some unknown amount from a "shipped to retailers" type of shipment like these Wii numbers (and modern Sony numbers) use. The other is that, simply, the sales we look at from Famitsu or NPD or wherever themself are imperfect, and their methods do change over time. Measures of PS2 in 2000-2002 could be more or less accurate than measures of Wii in 2006-2008.

Changing gears to DS. The historical comparison in this case is to its predecessor the GBA.


As you can see, DS shipments nearly match GBA's shipments, in much less time. Unless next quarter is a big drop from this one, expect DS to overtake GBA at that time.

One thing that's interesting to note, though, is the very different way the portable systems have been spread worldwide.


Over half of worldwide GBA shipments went to North America. Europe was a distant second, with Japan in third.


DS, on the other hand, is spread out much more evenly worldwide. Each region has spent at least some time in both first, second, and third place. Currently it looks like Europe is pulling away.

So we've looked at how these two systems have performed compared to their historical competition, but how do they compare to each other?


Through about seven quarters of each, Wii has a healthy lead of what appears to be about 7 million. Wii is actually ahead of where DS was after its eighth quarter. Wii's quicker takeoff probably owes a lot to the big success it took DS 1-2 years to find.

I'll close with an image and phrase that I've become a bit known for by this point: "There are more Wiis available than any near-launch home console ever." We're not so near launch as we were when I first said it, but hey. Not much else to say about the image; Wii and PS2 were already discussed earlier, and nothing else compares to them.

7/30/08


© 2008-2009 ChartGet.com - All rights reserved. All trademarks are properties of their respective owners.

ChartGet has no affiliation with manufacturers or sales tracking companies. All data used is public information.