


10/31/08
Investor Relations: EA 2Q FY09 Results ($310M Net Loss)
10/30/08

Console Notes:
Check out the 360 total this quarter. Unbelievable! More than its console competitors combined.
Handheld Notes:
Gaming's greatest secret? WIRELESS BEATS DS AND PSP THIS QUARTER!
Fascinating quarter. Read the full report @ EA's Official Site
10/30/08
Media Create Sales: 10/20 - 10/26 (Software)
10/29/08


 01. [NDS] Wagamama Fashion Girls Mode (Nintendo) 76,000 / NEW
02. [PS2] Devil Summoner: Kuzunoha Raidou tai Abaddon Ou (Atlus) 63,000 / NEW
03. [NDS] Pokémon Platinum (Pokémon) 53,000 / 1,810,000
04. [WII] Rhythm Tengoku Gold (Nintendo) 44,000 / 1,051,000
05. [WII] Wii Music (Nintendo) 38,000 / 129,000
06. [PSP] Yuusha no Kuse ni Namaikida Or 2 (SCE) 27,000 / 86,000
07. [PS2] Devil Summoner: Kuzunoha Raidou tai Abaddon Ou (Special) (Atlus) 25,000 / 25,000
08. [NDS] Castlevania: Order of Ecclesia (Konami) 19,000 / 19,000
09. [PSP] Bleach: Soul Carniva (SCE) 18,000 / 18,000
10. [WII] Wii Fit (Nintendo) 15,000 / 2,756,000
11. [NDS] Saihai no Yukue (KOEI)
12. [WII] Tenchu 4 (From Software)
13. [NDS] Galileo (D3)
14. [PS2] Shin Sangoku Musou 5 Special (KOEI)
15. [NDS] Soul Eater DS (Namco Bandai)
16. [NDS] Culdcept DS (SEGA)
17. [PSP] Macross Ace Frontier (Namco Bandai)
18. [PS2] Kidou Senshi Gundam 00: Gundam Meisters (Namco Bandai)
19. [WII] Mario Kart Wii (Nintendo)
20. [NDS] Inazuma Eleven (Level 5)
21. [NDS] Dragonball DS (Namco Bandai)
22. [PS2] Super Robot Wars Z (Namco Bandai)
23. [PSP] Garnet Chronicle (SEGA)
24. [WII] Wii Sports (Nintendo)
25. [NDS] Daigasso! Band Brothers DX (Nintendo)
26. [WII] Happy Dance Collection (Namco Bandai)
27. [PSP] NBA Live 09 (Electronic Arts)
28. [NDS] Taiko Drum Master 2: The Seven Island Adventure (Namco Bandai)
29. [PS3] NBA Live 09 (Electronic Arts)
30. [NDS] Mario Kart DS (Nintendo)
10/29/08
Investor Relations: Ubisoft First Half Fiscal Year Results
10/28/08
![]() Choice quotes from the release:
Choice quotes from the release:
Sales
Second-quarter sales totaled €175 million, representing an increase of 37.3% (43.6% at constant exchange rates) on the €127 million posted for the second quarter of 2007-08. This performance – which exceeded the guidance of approximately €160 million issued when Ubisoft released its sales figures for first-quarter 2008-09 – was primarily attributable to:
− The successful launches of Brothers in Arms Hell's Highway™ and SoulCalibur™IV
(Europe) for the Xbox360™ and PLAYSTATION®3.
− Solid sales turned in by casual games including new titles such
Increase expected for first-half current operating income
Based on currently available information, Ubisoft expects current operating income before stock options to represent a marked increase compared with the 3.4% of sales recorded for the first half of 2007-08. This rise mainly reflects the leverage effect on structure costs related to the strong increase in sales, as well as the favorable impact of the “Games for Everyone” range which requires a low level of R&D expenditure.
Market share:
In the first nine calendar months of 2008, Ubisoft was the number 4 independent publisher in the United States with 5.1% market share (compared with number 4 and 5.6% one year earlier); number 3 in Europe with 8.1% market share (compared with number 3 and 7.9%); number 2 in France with 7.5% market share (compared with number 3 and 7.5%); number 4 in the United Kingdom with 8.4% market share (compared with umber 3 and 9.0%); and number 3 in Germany with 7.6% market share (compared with number 3 and 6.9%).
Breakdown of sales by platform - First Half FY2008

Stay right here for the latest in financial statements, platform mix %, and charts. Will be updating throughout the day.
Update:
added Platform mix chart.
10/28/08
Media Create Projections: (10/20-10/26)
10/27/08
Last Week's Results:
 Analysis:
I nailed the DS and PSP projections, hitting 97% accuracy on each, and was within 1800 units on both the 360 and PS3 projections.
The Wii was down further than expected, but a closer look at the chart on the right shows that it really is falling in line with YOY expectations.
What I'm seeing on a week-to-week basis is that the Adjusted YOY method works. The same things are happening at the same time and this method works for establishing predictability when markets are in a set pattern. That Wii 2008 line vs. the Wii 2007 line is breathtaking.
As it is now, my method is not set in stone and does not have a set equation, but is based on YOY data, current trends, and upcoming releases. I am attempting to establish an equation that can reasonably predict sales results within a huge +/- 5% error. My current method (sans equation) allows a +/- 3.2k unit difference, but a more disappointing accuracy percentage.
Last Week:
DS: 29,839
PSP: 159,816
WII: 26,024
360: 7,856
PS2: 7,261
PS3: 4,725
Average, Last 4 Weeks:
DS: 40,496
PSP: 58,858
WII: 25,136
360: 8,795
PS2: 8,177
PS3: 6,492
Last Year This Week:
DS: 76,273
PSP: 59,792
WII: 27,502
360: 3,718
PS3: 18,785
Projections 10/20 - 10/26:
DS: 30,000
PSP: 85,000
WII: 29,000
360: 7,500
PS3: 5,000
Notes, Ideas, Justifications, Expectations:
DS staying steady while DSi hype builds, PSP loses almost 50% of hardware bump after its first week, Wii mirrors 2007 exactly, 360 consistent for past 3 weeks, all confidence in PS3 lost--won't move past 5k until something changes.
SYSTEM PROJECTED    ACTUAL  DIFFERENCE  ABS DIF  ADJ % ACC
DS        30,500    29,839        661       661     97.78%
PSP      155,500   159,816     -4,316     4,316     97.30%
WII       34,000    26,024      7,976     7,976     69.35%
360        6,300     7,856     -1,556     1,556     80.19%
PS3        6,500     4,725      1,775     1,775     62.43%
TOTAL    232,800   228,260      4,540    16,284
AVG                                       3,257     81.41%
Analysis:I nailed the DS and PSP projections, hitting 97% accuracy on each, and was within 1800 units on both the 360 and PS3 projections.
The Wii was down further than expected, but a closer look at the chart on the right shows that it really is falling in line with YOY expectations.
What I'm seeing on a week-to-week basis is that the Adjusted YOY method works. The same things are happening at the same time and this method works for establishing predictability when markets are in a set pattern. That Wii 2008 line vs. the Wii 2007 line is breathtaking.
As it is now, my method is not set in stone and does not have a set equation, but is based on YOY data, current trends, and upcoming releases. I am attempting to establish an equation that can reasonably predict sales results within a huge +/- 5% error. My current method (sans equation) allows a +/- 3.2k unit difference, but a more disappointing accuracy percentage.
Last Week:
DS: 29,839
PSP: 159,816
WII: 26,024
360: 7,856
PS2: 7,261
PS3: 4,725
Average, Last 4 Weeks:
DS: 40,496
PSP: 58,858
WII: 25,136
360: 8,795
PS2: 8,177
PS3: 6,492
Last Year This Week:
DS: 76,273
PSP: 59,792
WII: 27,502
360: 3,718
PS3: 18,785
Projections 10/20 - 10/26:
DS: 30,000
PSP: 85,000
WII: 29,000
360: 7,500
PS3: 5,000
Notes, Ideas, Justifications, Expectations:
DS staying steady while DSi hype builds, PSP loses almost 50% of hardware bump after its first week, Wii mirrors 2007 exactly, 360 consistent for past 3 weeks, all confidence in PS3 lost--won't move past 5k until something changes.
10/27/08
Famitsu Sales Shares: 2008-10-06
10/26/08
These graphs include sales through Oct 12/08.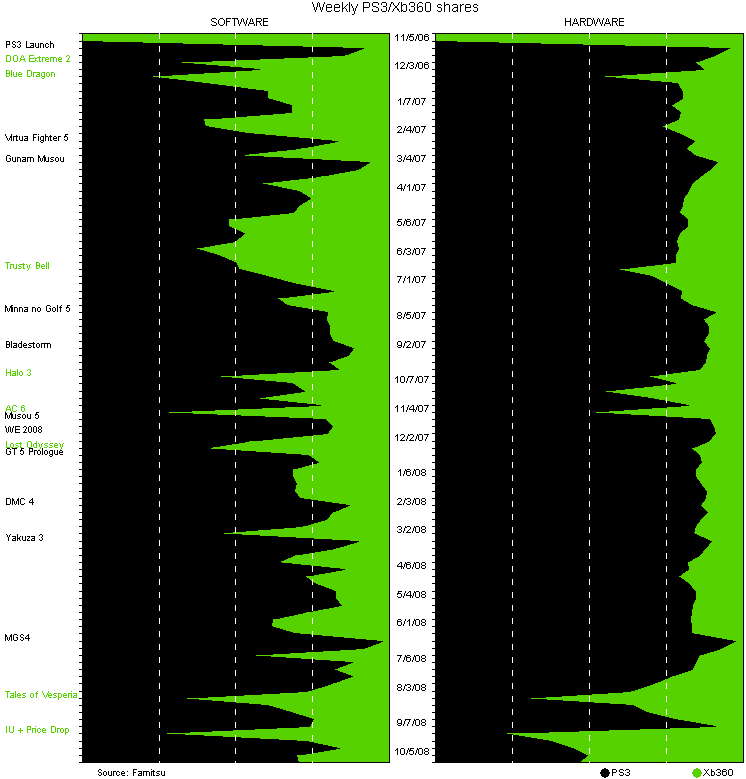
Portables vs home consoles: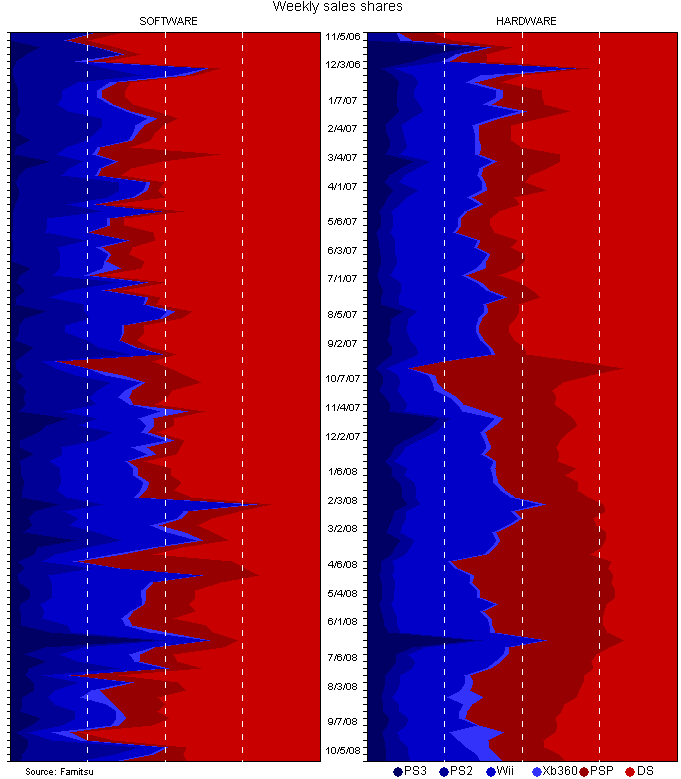
10/26/08
MC 2008-10-13 and Famitsu 2008-10-06: Things of Note
10/24/08
![]() Based on the latest Famitsu hardware data...
Based on the latest Famitsu hardware data...
PSP comparisons: After 201 weeks, PSP is where PS2 was at 148.6 weeks (January 2, 2003), where DS was at 89.8 weeks (August 18, 2006), and where GBA was at 127.7 weeks (August 29, 2003).
X360 comparisons: After 149 weeks, X360 is where GCN was at 14.8 weeks (December 21, 2001), where PS3 was at 17.3 weeks (March 6, 2007), and where Wii was at 3.9 weeks (December 22, 2006).
PS3 comparisons: After 101 weeks, PS3 is where PS2 was at 22.0 weeks (July 29, 2000), where PSP was at 53.6 weeks (December 15, 2005), where GCN was at 102.5 weeks (August 27, 2003), and where Wii was at 24.0 weeks (May 13, 2007).
I'm not sure of the exact date the new PS3 bundle hits, but it looks like there's a real chance for GCN to pass PS3 one last time at 103 weeks apiece before PS3 bumps up again for the holidays and GCN moves onto its shittier post-2003 performance.
Wii comparisons: After 98 weeks, Wii is where GBA was at 90.2 weeks (December 9, 2002), where DS was at 70.5 weeks (April 5, 2006), where PS2 was at 98.8 weeks (January 18, 2002), and where PSP was at 154.5 weeks (November 21, 2007).
Similarly, it looks like Wii and PS2 will cross paths at 99 or 100 weeks apiece, though with PS2 exiting its holiday season and Wii entering it that one won't last much longer than GCN > PS3.
On a longer-looking historical note, though after DS's recent few massive years none of the hardware numbers this year look quite as impressive, things seem more impressive if we compare to what was considered massive success before DS. Though none of this year's systems are doing as well as PS2 in its best calendar year, that there are three doing at least 75% as well is notable.
Based on the latest Media Create hardware numbers...
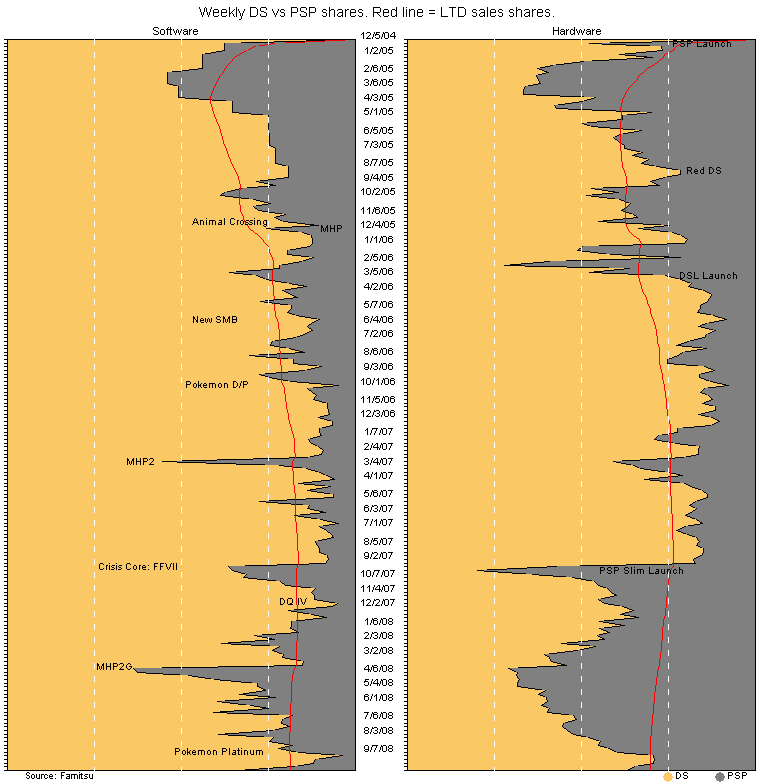
DS vs PSP: Weekly shares of 15.7 / 84.3, PSP's highest share since... the week DS wasn't out yet. This brings total shares to 69.1 / 30.9. At this week's rates PSP catches up to DS in 100.4 weeks (September 22, 2010). If DS stopped selling and PSP continued at this week's rate, it would catch up in 81.6 weeks (May 14, 2010).
X360 vs PS3: Weekly shares of 62.4 / 37.6 bring total shares to 23.5 / 76.5. At this week's rates X360 catches up to PS3 in 517.9 weeks (September 23, 2018). If PS3 stopped selling and X360 continued at this week's rate, it would catch up in 206.4 weeks (October 3, 2012).
PS3 vs Wii: Weekly shares of 15.4 / 84.6 bring total shares to 25.4 / 74.6. If Wii stopped selling and PS3 continued at this week's rate, it would catch up in 960.6 weeks (March 19, 2027).
Week over week, the system with the new SKU is way up (PSP), the systems awaiting new SKUs are down (DS, PS3), and everything else is slightly up.
Famitsu Software Stuff
Quite a few games popped back up on the top 30 this week having been gone for two weeks. Always noticeable on my end because it's not so easy to identify them based on what the list gives as their previous rank! Monster Hunter Portable 2G, New Super Mario Bros., Wii Play, Animal Crossing Wild World, and the first Taiko no Tatsujin DS.
10/24/08
Subscribe to:
Posts (Atom)


