Showing posts with label Japan. Show all posts

Landmark: 360 Hits 900k in Japan; Still Short of Goal

2/19/09

Japan - Just four short months ago we posted an article that quoted Microsoft's goal of one million units for the land of the rising sun.

That goal came a little bit closer to reality last week, if only incrementally: 360 has now passed the nine hundred thousand barrier and is just one hundred thousand short of Microsoft's goal.

When the goal was first asserted back in October, the 360 was hovering near seven hundred thousand units. Since then the 360 has seen a two hundred thousand unit surge in four months.

While some scoff at the American entry's attempts at Japanese assimilation, there's little doubt that Microsoft's machine has altered the market forever.

Potentially the most important factor is that Microsoft forced Sony to answer to the 360 before they were done milking the PS2 for long-tail software sales.

Instead, Sony pushed through plans to produce a hardware behemoth that would compete with the 360 in the US. The effects of this have been clearly felt in Japanese sales, where Sony's entry is lagging far behind the third player in the market, Nintendo's Wii.

There are numerous reasons why the PS3 hasn't met expectations (and they've been covered to death), but no small part of that analysis is price which is clearly related to hardware costs...and Microsoft, in whole or in part, can take credit (or blame) for forcing Sony's hand on the issue.

Whether or not Microsoft will translate the paltry-but-not-nonexistent userbase into future profits in the Japanese market is to be determined. But this is a start.

(click to enlarge)

2/19/09

Console Sales Fall Sharply in Japan Amid Recession

1/30/09

Japan - Even the red-hot Nintendo isn't immune to the belt-tightening fear of recession. Just weeks after what was is the biggest part of the year, console sales are down across the board to a shocking low.

Compared to this week last year, the Wii is selling barely 42% of its previous total (2008: 26.7k, 2007: 63.5k). However, Sony's PS3 and Microsoft's XBOX 360 are both up several thousand units comparatively, but the Wii's 68% market share means this is a significant contraction indeed.

In a striking reality check, Nintendo (the company with untold billions of cash on hand) saw it's stock drop 12% after it cut its earnings forecast.

Stay right here for the latest and we take a look at how handheld sales are effected.


(click to enlarge)


1/30/09

Analyst: "Lifestyle" Systems to be hit hardest during recession (EDGE)

11/18/08

EDGE is reporting on an interview in which analyst Piers Harding-Rolls has said that lifestyle systems will be impacted most during a recession in Japan.

“ 'The new mainstream consumers that play lifestyle and social games on the Wii and DS are more likely to be outside that core demographic and may be impacted more by a recession,” he says, adding that it is this market who may consider games and consoles a much more discretionary spend compared to 18-35 males.' "

Read the entire article @ EDGE.

11/18/08

Famitsu Sales Shares: 2008-10-06

10/26/08

These graphs include sales through Oct 12/08.

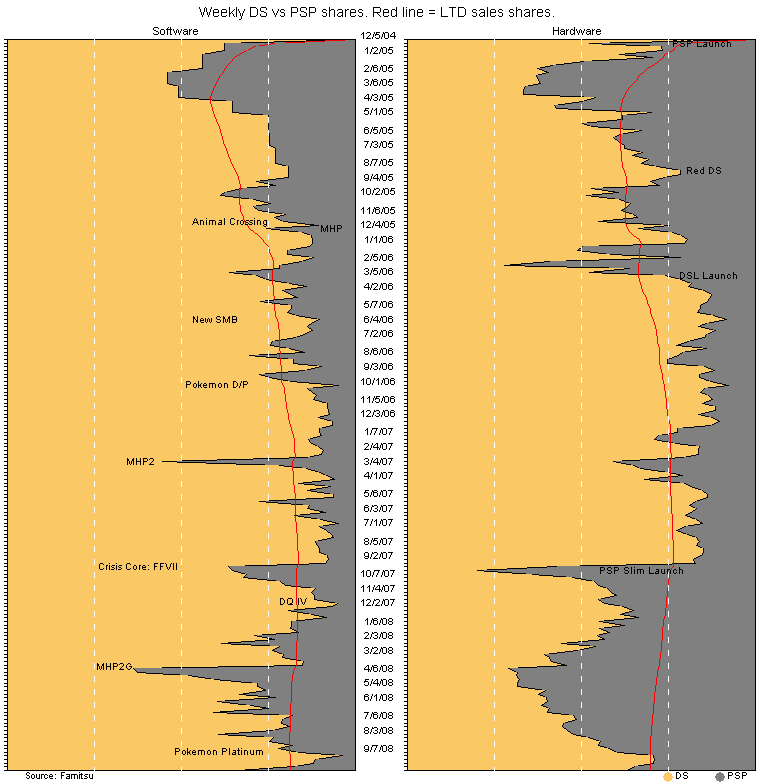
Portables vs home consoles:

10/26/08

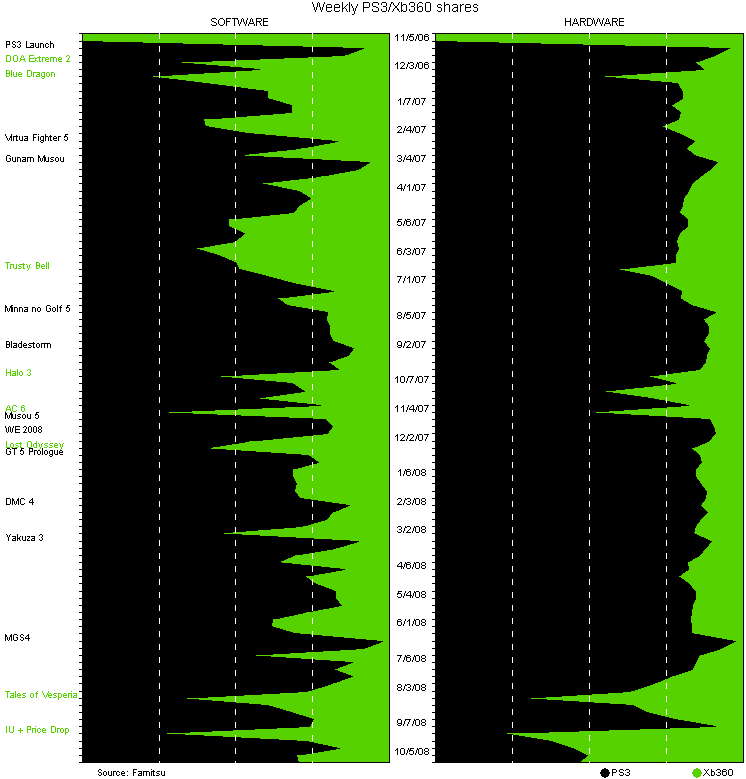
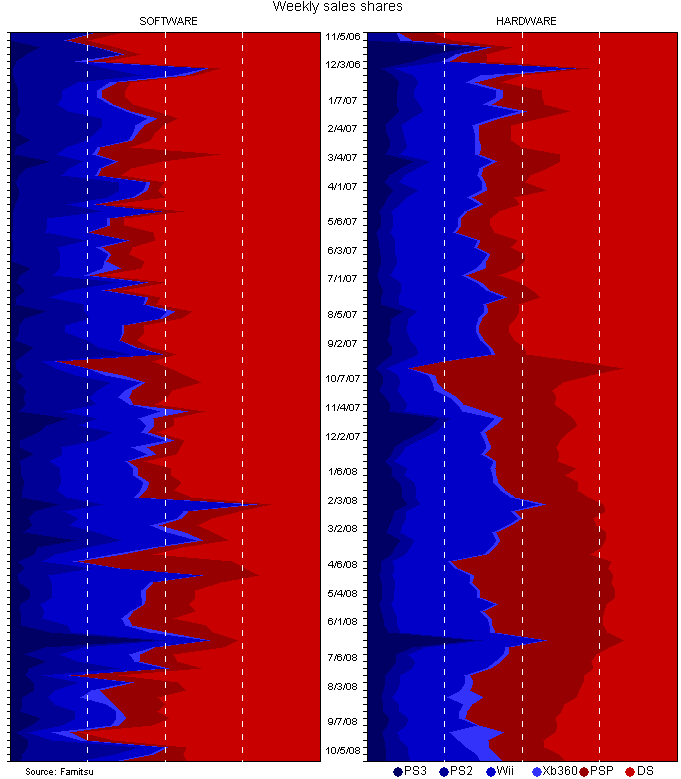
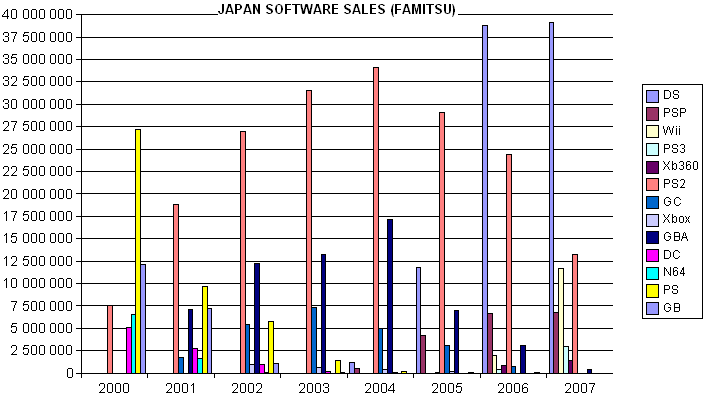
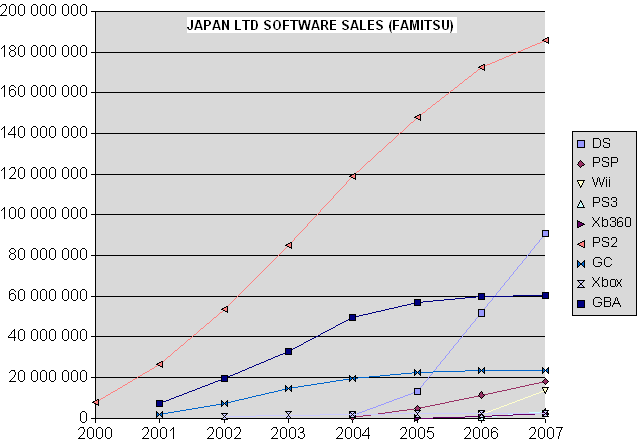
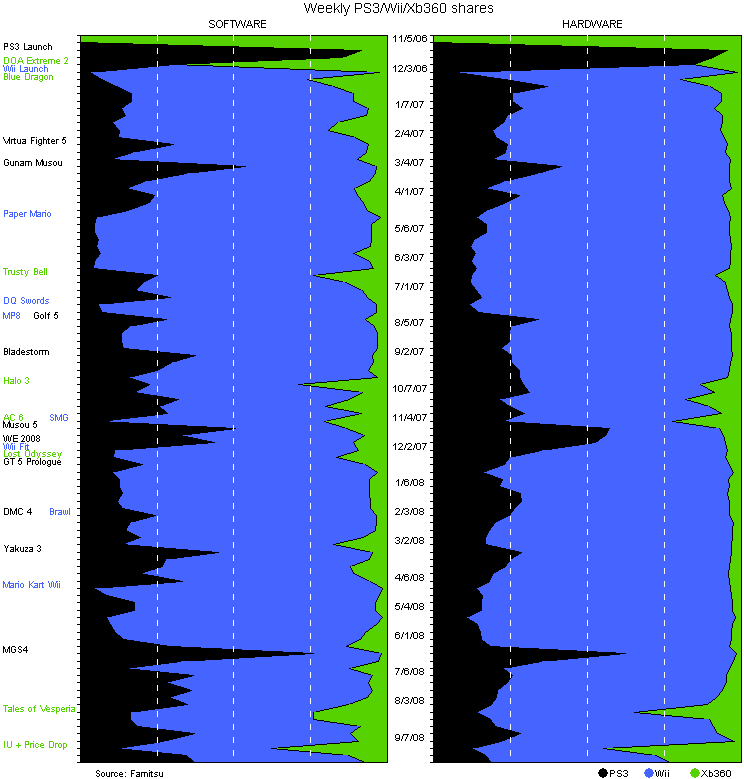
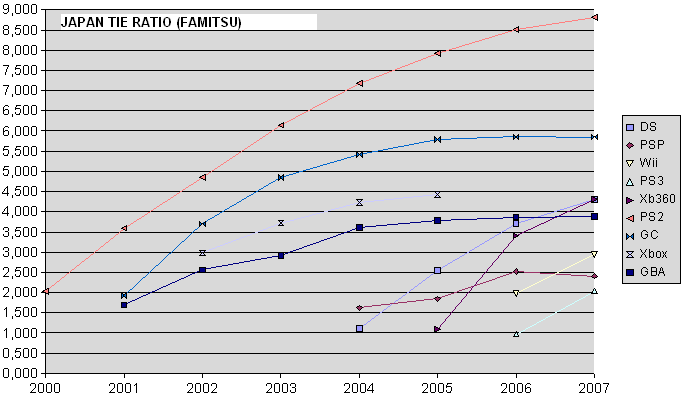
Japan Software & Hardware Graphs (Share Charts)

10/12/08

Some graphs I've made the past week:


10/12/08

Microsoft targets 1 million Xbox 360 sales in Japan

10/11/08

Microsoft Corp’s Japanese unit aims to achieve its domestic sales target of one million units for the Xbox 360 video game console as quickly as possible, a senior official said on Friday. Microsoft Co, the U.S. software giant’s unit, hopes to boost sales by leveraging new games and boosting sales promotion efforts, Takashi Sensui, executive officer and chief of the home and entertainment division of the Tokyo-based firm, said.


Read the whole article at JapanToday.


Analysis & Opinion

Can they do it? At roughly seven hundred thousand units sold in Japan, they need three hundred to reach that magical mark of one million units. If we start with the base assumption that the 360 will be around for exactly three more years before being replaced by its successor (the 720?), then we can extrapolate that it needs to sell one hundred thousand per year to do so.

Breaking it down further, that's 3 years at 52 weeks for a total of 156 weeks. Dividing 300,000 by 156 leaves us with 1,923 units per week for three full years to be able to reach one million.

Based on our previous assumption, this should be extremely easy, especially since at 360's lowest point ever it was still averaging 1k+. With a few bumps during big holiday periods and a few big title releases, this should absolutely be possible. What could prevent this? Clearly, the 360 being replaced early in Japan would be the biggest cause for concern.

What does it mean? What does a million units in the land of Nintendo's Wii and DS soaring into the stratosphere and Sony's PS2 having already broke every record for console sales in history? Not much, honestly. But what Microsoft has successfully done is leverage the audience of hardcore gamers unsatisfied by Nintendo's and Sony's offerings into a palpable base that can impact the market. Most importantly, they successfully dictated to Sony the schedule at which "next gen" would begin. One million units is a good launch pad from which to try that again.

PL

10/11/08

MC 2008-09-15 and Famitsu 2008-09-08: Things of Note

9/26/08

Based on the latest Famitsu hardware numbers...
PSP comparisons: After 197 weeks, PSP is where PS2 was at 148.0 weeks (December 29, 2002), where DS was at 89.0 weeks (August 13, 2006), and where GBA was at 125.9 weeks (August 15, 2003).

PS3 comparisons: After 97 weeks, PS3 is where PS2 was at 21.5 weeks (July 26, 2000), where PSP was at 53.3 weeks (December 13, 2005), where GCN was at 101.0 weeks (August 16, 2003), and where Wii was at 23.5 weeks (May 9, 2007).

Wii comparisons: After 94 weeks, Wii is where GBA was at 89.5 weeks (December 4, 2002), where DS was at 70.1 weeks (April 2, 2006), where PS2 was at 97.8 weeks (January 11, 2002), and where PSP was at 153.2 weeks (November 12, 2007).

Based on the latest Media Create hardware numbers...
DS vs PSP: Weekly shares of 68.1 / 31.9 bring total shares to 69.4 / 30.6. If DS stopped selling and PSP continued at this week's rate, it would catch up in 457.6 weeks (June 29, 2017).

PS3 vs Wii: Weekly shares of 21.4 / 78.6 bring total shares to 25.5 / 74.5. If Wii stopped selling and PS3 continued at this week's rate, it would catch up in 547.4 weeks (March 20, 2019).

X360 vs PS3: Weekly shares of 62.8 / 37.2 bring total shares to 22.8 / 77.2. At this week's rate X360 catches up to PS3 in 290.1 weeks (April 14, 2014). If PS3 stopped selling and X360 continued at this week's rate, it would catch up in 118.4 weeks (December 29, 2010).

PSP vs Wii: Weekly shares of 48.9 / 51.1 bring total shares to 60.4 / 39.6. At this week's rates Wii catches up to PSP in 2,870.2 weeks (September 25, 2063). If PSP stopped selling and Wii continued at this week's rate, it would catch up in 119.6 weeks (January 7, 2011).

Week over week, things are incredibly flat with the exception of X360 coming down from the height of its bump.


Famitsu Software Pie
DS: 77.4
Wii: 7.7
X360: 5.8
PS2: 4.0
PSP: 2.9
PS3: 1.9
Other: 0.3

An interesting week here for two reasons. One, X360 software outsold the software for each individual Sony system. For another, first-place DS sold ten times as much software as second-place Wii.

Famitsu Software Stuff

Pokémon Platinum starting off much bigger than Emerald.


It also creamed the rest of the top 30 combined.


Mario Kart Wii reaches 1,719,388. Though I don't have pre-PS2 games in the database to create a graphical comparison, the last known Mario Kart 64 total was 1,711,661, so MK Wii has beaten its N64 predecessor, which was also the best-selling N64 game in Japan. It's also worth noting that MK64 had significant legs. As of the end of 1997 (13 months on the market), MK64 was only up to 1.2 million.

9/26/08

MC 2008-09-08 and Famitsu 2008-09-01: Things of Note

9/19/08

Based on the latest Famitsu hardware numbers...

PSP comparisons: After 196 weeks, PSP is where PS2 was at 147.9 weeks (December 28, 2002), where DS was at 88.8 weeks (August 11, 2006), and where GBA was at 125.4 weeks (August 13, 2003).

PS3 comparisons: After 96 weeks, PS3 is where PS2 was at 21.3 weeks (July 25, 2000), where PSP was at 53.2 weeks (December 12, 2005), where GCN was at 100.6 weeks (August 14, 2003), and where Wii was at 23.3 weeks (May 8, 2007).

Wii comparisons: After 93 weeks, Wii is where GBA was at 89.3 weeks (December 3, 2002), where DS was at 70.0 weeks (April 1, 2006), where PS2 was at 97.5 weeks (January 9, 2002), and where PSP was at 152.7 weeks (November 9, 2007).

Based on the latest Media Create hardware numbers...

DS vs PSP: Weekly shares of 67.9 / 32.1, DS's strongest since the week before Crisis Core. This brings total shares to 69.4 / 30.6. If DS stopped selling and PSP continued at this week's rate, it would catch up in 434.0 weeks (January 8, 2017).

X360 vs PS3: Weekly shares of 77.8 / 22.2 bring total shares to 22.5 / 77.5. At this week's rates, X360 catches PS3 in 81.3 weeks (April 6, 2010). If PS3 stopped selling and X360 continued at this week's rate, it would catc up in 58.1 weeks (October 26, 2009).

PS3 vs Wii: Weekly shares of 21.3 / 78.7, bringing total shares to 25.5 / 74.5. If Wii stopped selling and PS3 continued at this week's rate, it would catch up in 551.7 weeks (April 12, 2019).

X360 is now having its best year ever, besting its 2007 performance this far in.


Week over week, most systems are slightly down, with two notable exceptions. DS kicks up more than 10K, and X360 bursts out of its shortage to nearly Wii and PSP levels. It's worth noting that while this week Media Create has PSP > Wii > X360, Famitsu has X360 > Wii > PSP. Very close.


Famitsu software Stuff

Numerous games reenter the top 30 this week after new games from the previous week or two have died down: Fatal Frame, New Super Mario Bros., Derby Stallion DS, Beautiful Letter Training, and the first DS Taiko no Tatsujin.

Fatal Frame: Mask of the Lunar Eclipse (3062) is performing steadily, and is now very near the top two games in the series. Seems it has a good chance to become the top seller in the series, though it's possible we won't see that before it drops out of the weekly Top 30.


Wario Land: Shake It! continues crawling, but at a slowing pace. The last three weeks have been 7.6K -> 5.4K -> 3.6K. I doubt we see it in the Top 30 again.

9/19/08

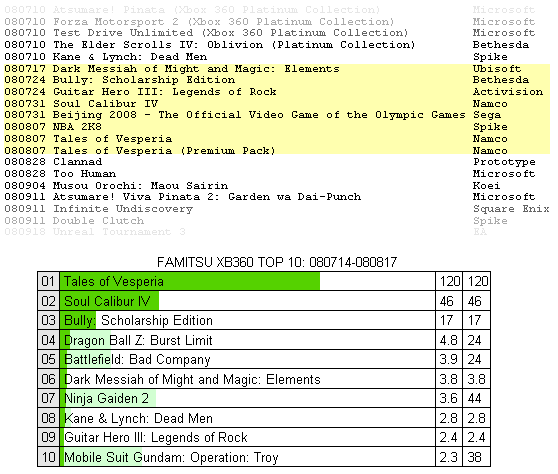
XB360 Top 10, July 14/08 - Aug 17/08

9/18/08

Hi, this is my first post.
Let's see if I can upload an image. Hmm...


Total domination by Namco there.

9/18/08

MC 2008-09-01 and Famitsu 2008-08-25: Things of Note

9/15/08

Sorry this is a few days late. I spent too much time this weekend selling spice across the galaxy.

Based on the latest Famitsu hardware data...
PSP comparisons: After 195 weeks, PSP is where PS2 was at 147.7 weeks (December 26, 2002), where DS was at 88.6 weeks (August 9, 2006), and where GBA was at 124.9 weeks (August 9, 2003).

PS3 comparisons: After 95 weeks, PS3 is where PS2 was at 21.2 weeks (July 24, 2000), where PSP was at 53.1 weeks (December 12, 2005), where GCN was at 100.2 weeks (August 11, 2003), and where Wii was at 23.2 weeks (May 7, 2007).

Wii comparisons: After 92 weeks, Wii is where GBA was at 89.1 weeks (December 1, 20020, where DS was at 69.8 weeks (March 31, 2006), where PS2 was at 97.3 weeks (January 7, 2002), and where PSP was at 152.2 weeks (November 5, 2007).

Based on the latest Media Create hardware data...
DS vs PSP: Weekly shares of 59.9 / 40.1, DS's strongest since December 2007. This brings total shares to 69.4 / 30.6. If DS stopped selling and PSP continued at this week's rate, it would catch up in 378.8 weeks (December 12, 2015).

PS3 vs Wii: Weekly shares of 20.1 / 79.9, bringing total shares to 25.5 / 74.5. If Wii stopped selling and PS3 continued at this week's rate, it would catch up in 531.6 weeks (November 15, 2018).

Week over week, everything is down a little, but X360 plummets (relatively), presumably due to the shortage issues.


Famitsu software stuff
From the numbers given when Fire Emblem returned to the Top 30 (Top 10, even), we can see it dipped to under 4K the week it disappeared.


This week mostly out of stock placed it (3152) back behind the first GBA Fire Emblem (823) in sales from launch.


And now a couple pointless inappropriate software versuses, just because I notice their current totals are similar.


New software group: Silicon Knights.

Twin Snakes (1730) may have done awfully for a Metal Gear game, but compared to Eternal Darkness (888) and Too Human (3168) it looks pretty big.

9/15/08

MC 2008-08-25 and Famitsu 2008-08-18: Things of Note

9/5/08

Based on the latest Famitsu numbers...

PSP comparisons: After 194 weeks, PSP is where PS2 was at 147.5 weeks (December 25, 2002), where DS was at 88.2 weeks (August 7, 2006), and where GBA was at 124.2 weeks (August 4, 2003).

PS3 comparisons: After 94 weeks, PS3 is where PS2 was at 21.0 weeks (July 22, 2000), where PSP was at 53.0 weeks (December 11, 2005), where GCN was at 99.7 weeks (August 7, 2003), and where Wii was at 23.0 weeks (May 5, 2007).

Wii comparisons: After 91 weeks, Wii is where GBA was at 88.9 weeks (November 30, 2002), where DS was at 69.7 weeks (March 30, 2006), where PS2 was at 97.0 weeks (January 6, 2002), and where PSP was at 151.7 weeks (November 2, 2007).

Not much notable to point out on software this week. No huge new games and the notable games with continued presence aren't behaving very differently than last time I showed them.

Based on the latest Media Create numbers...

DS vs PSP: Weekly shares of 57.5 / 42.5 bring total shares to 69.4 / 30.6. If DS stopped selling and PSP continued at this week's rate, it would catch up in 312.9 weeks (August 31, 2014).

PS3 vs Wii: Weekly shares of 21.5 / 78.5 bring total shares to 25.5 / 74.5. If Wii stopped selling and PS3 continued at this week's rate, it would catch up in 449.7 weeks (April 15, 2017).

X360 vs PS3: Weekly shares of 24.2 / 75.8 bring total shares to 21.9 / 78.1. If PS3 stopped selling and X360 continued at this week's rate, it would catch up in 527.9 weeks (October 14, 2018).

And here's something I think might be an interesting thing to do pretty regularly, even if this week it's most notable for being pretty boring. By doing a line graph for just two weeks with all the current systems, we can see the week over week change. This week most things are remarkably flat. PSP sticks out, but it's still less than a 10% drop.

9/5/08

MC 2008-08-18 and Famitsu 2008-08-04 & 2008-08-11: Things of Note

8/29/08

Based on the latest Famitsu numbers...

PSP comparisons: After 193 weeks, PSP is where PS2 was at 147.2 weeks (December 23, 2002), where DS was at 87.9 weeks (August 5, 2006), and where GBA was at 123.4 weeks (July 29, 2003).

PS3 comparisons: After 93 weeks, PS3 is where PS2 was at 20.8 weeks (July 21, 2000), where PSP was at 53.0 weeks (December 10, 2005), where GCN was at 99.3 weeks (August 4, 2003), and where Wii was at 22.9 weeks (May 5, 2007).

Wii comparisons: After 90 weeks, Wii is where GBA was at 88.7 weeks (November 28, 2002), where DS was at 69.6 weeks (March 29, 2006), where PS2 was at 96.9 weeks (January 5, 2002), and where PSP was at 151.2 weeks (October 29, 2007).

For a while now Wii will appear to get further behind GBA, since GBA is entering a holiday period. However, Wii is almost through PS2's biggest holiday period. If Wii has a weak next few months it might briefly fall behind PS2 before shooting ahead again due to its own holiday boost.


Famitsu software stuff:

Wario Land remains slow but steady.


Fatal Frame Wii (3062) remains well in the middle.


Rhythm Tengoku Gold continues to look ridiculous next to its predecessor.


Based on the latest Media Create numbers...
DS vs PSP: Weekly shares of 54.0 / 46.0 bring total shares to 69.5 / 30.5. If DS stopped selling and PSP continued at this week's rate, it would catch up in 273.5 weeks (November 21, 2013).

PS3 vs Wii: Weekly shares of 20.4 / 79.6 bring total shares to 25.5 / 74.5. If Wii stopped selling and PS3 continued at this week's rate, it would catch up in 484.5 weeks (December 7, 2017).

PS3 2008 falls back behind PS3 2007.

8/29/08

MC 2008-08-11 and Famitsu 2008-07-28: Things of Note

8/22/08

Based on the latest Famitsu numbers...

PSP comparisons: After 191 weeks, PSP is where PS2 was at 146.4 weeks (December 17, 2002), where DS was at 87.0 weeks (July 30, 2006), and where GBA was at 120.8 weeks (July 11, 2003).

PS3 comparisons: After 91 weeks, PS3 is where PS2 was at 20.5 weeks (July 19, 2000), where PSP was at 52.7 weeks (December 8, 2005), where GCN was at 97.7 weeks (July 24, 2003), and where Wii was at 22.6 weeks (May 3, 2007).

Wii comparisons: After 88 weeks, Wii is where GBA was at 88.0 weeks (November 23, 2002), where DS was at 69.2 weeks (March 27, 2006), where PS2 was at 96.6 weeks (January 3, 2002), and where PSP was at 149.8 weeks (October 19, 2007).


New software groups:
Rhythm Tengoku Gold gets a fast start compared to its predecessor.


Soul Calibur The IVs are the one-week lines that aren't the smallest (which is II Xbox).


Other stuff:

Dragon Quest V DS's total remains lower than PS2's, but its third week number is ever so slightly higher. Better legs? They'd have to be significantly better to get far in catching up with the PS2 version's lead, though.


Fatal Frame IV's debut puts it way in the... middle.


Based on the latest Media Create numbers...

DS vs PSP: Weekly shares of 55.0 / 45.0, DS's strongest since the first week of the year. This brings total shares to 69.5 / 30.5. If DS stopped selling and PSP continued at this week's rate, it would catch up in 202.0 weeks (July 2, 2012).

PS3 vs Wii: Weekly shares of 17.7 / 82.3, Wii's strongest since two weeks before MGS4. This brings total shares to 25.6 / 74.4. If Wii stopped selling and PS3 continued at this week's rate, it would catch up in 381.3 weeks (December 9, 2015).


On week 33 of the year Wii passes 2 million. It did this last year on week 27.


DS also passes 2 million on week 33. It did this last year on week 14.


This was a holiday week in Japan, so almost everything was up by varying degrees. The exception: Xbox 360 returning to Earth from its Vesperia leap.

8/22/08

MC 2008-08-04: Things of Note

8/15/08

It looks like this is one of the times Famitsu will combine two weeks into one report, so I have much less to cover today. Not a good reason to completely skip a regular weekly entry, though.

First, you may have noticed a change in the appearance of my graphs. This was more than cosmetic. They now make much better use of space; particularly an issue with a fixed column width. Combined with Panther's recent widening of the columns here at LotusCharts, they should look much nicer than they used to.

DS vs PSP: Weekly shares of 50.8 / 49.2, bringing total shares to 69.6 / 30.4 At this week's rates, PSP catches up to DS in -6,725.0 weeks (September 23, 1879). If DS stopped selling and PSP continued at this week's rate, it would catch up in 222.2 weeks (November 13, 2012).

PS3 vs Wii: Weekly shares of 20.1 / 79.9, bringing total shares to 25.6 / 74.4. If Wii stopped selling and PS3 continued at this week's rate, it would catch up in 444.8 weeks (February 18, 2017).


Also of note: Media Create has Xbox 360 at 24,962 for this week. Incredible jump. X360 has only had two higher weeks: launch in December 2005 (43,970) and the week of Blue Dragon's release in December 2006 (35,343). It's also worth noting that on a direct unit basis rather than percentage, this week's jump over the previous week's was very similar to the jump GameCube had when Tales of Symphonia released. In both cases Tales had about a +20K effect on hardware sales, though in that case it was a jump from 15K to 36K.


Of course, this big X360 bump also put it over PS3. While this happened once before, it was by such a negligible amount you may not have noticed.


Make you squint? Let's zoom in.


This time, though, no zoom is necessary.

8/15/08


© 2008-2009 ChartGet.com - All rights reserved. All trademarks are properties of their respective owners.

ChartGet has no affiliation with manufacturers or sales tracking companies. All data used is public information.